Dashboard Details Follow

The Dashboard feature is customisable by each individual user. To set up your dashboard please see the Dashboard Setup page.
The Dashboard has several gadgets available:
- Top / Bottom 10 recipes on the basis of GP%
- Top 10 Sales items by Sales Value
- Orders by Employees
- Top 10 Products delivered in Period
- Top 10 Supplier on Delivery Amount
Please note that based on your user rights, you may not have access to all of these gadgets.
- Once you have selected a gadget, many of them have drill-down options.
- To drill down into a gadget, simply click on the bars of the graph:
- The drill down information will be based on your various (product / sales) categories, until you reach the product / recipe level.
- Depending on the gadget, various pieces of information will be displayed.
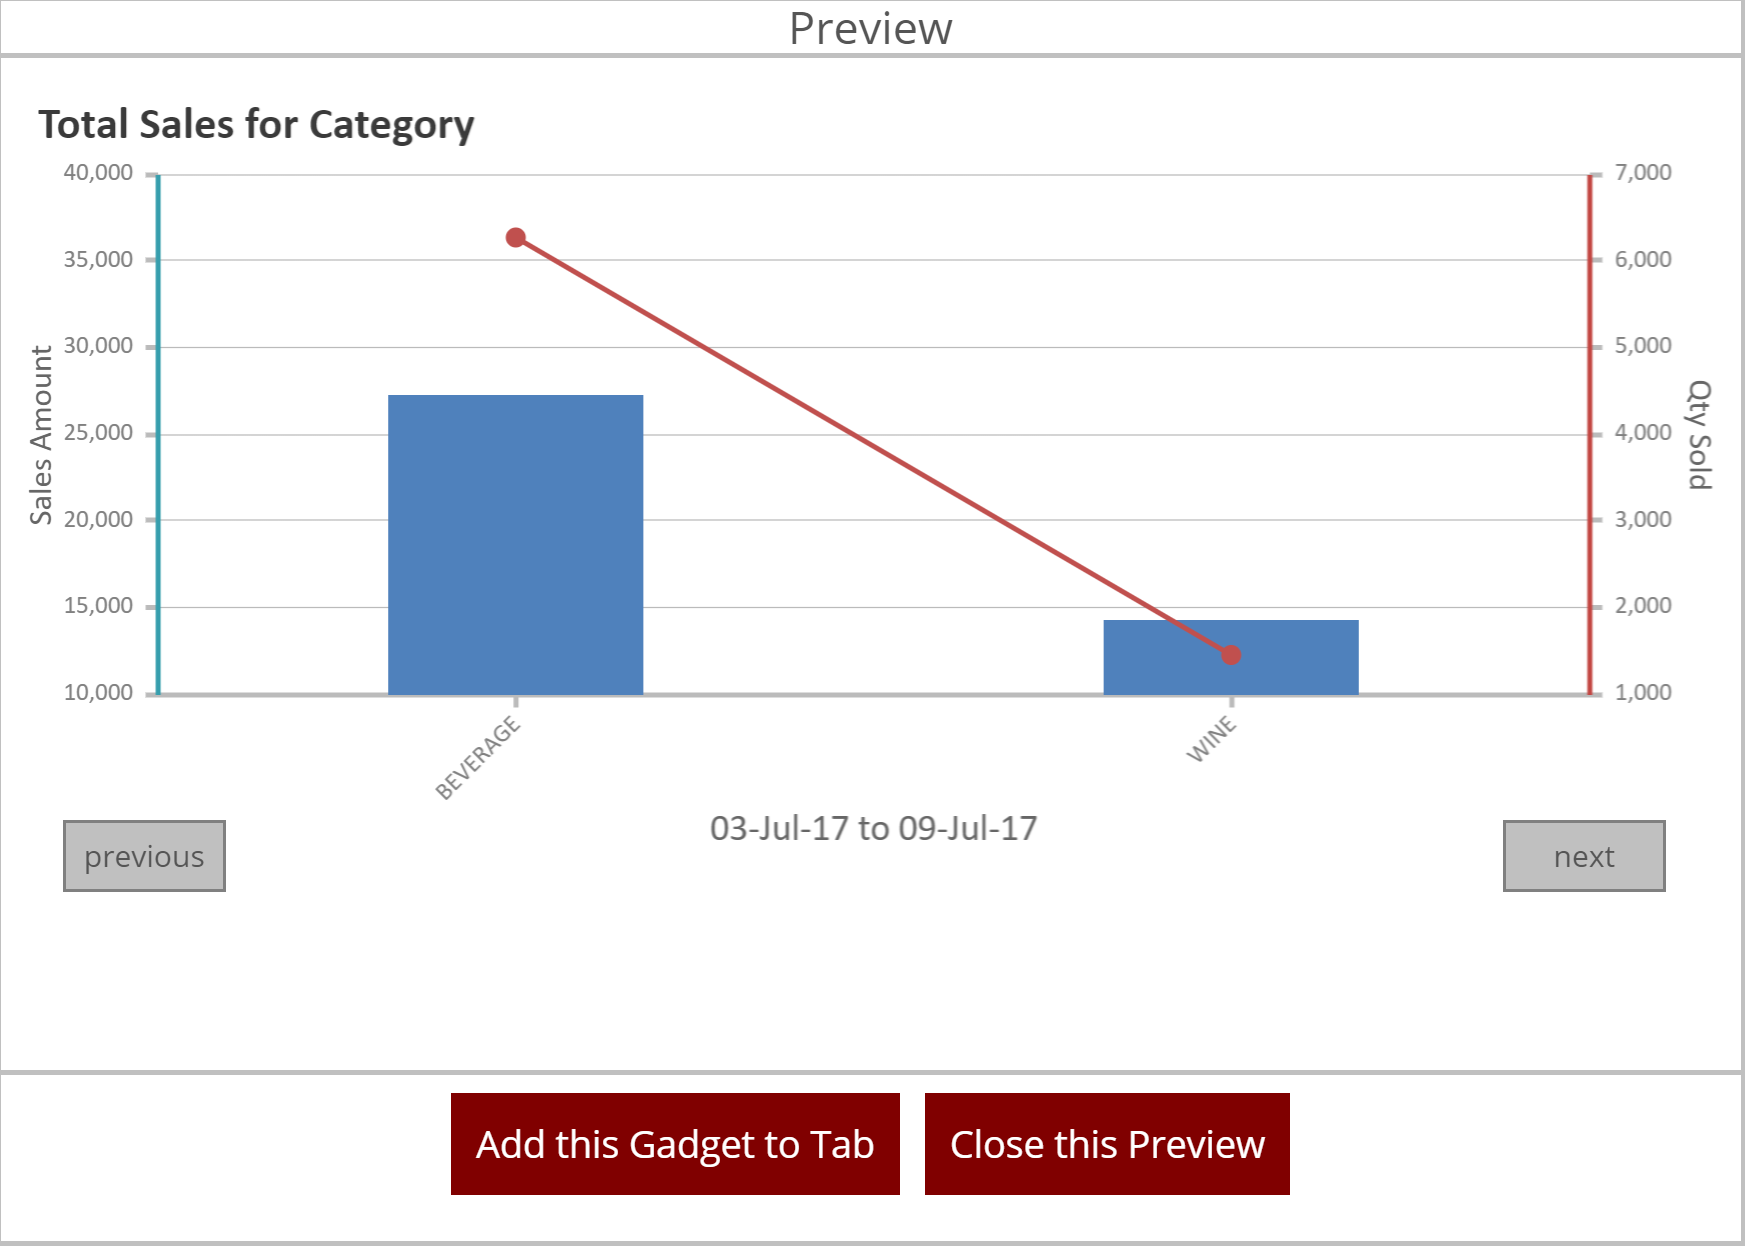
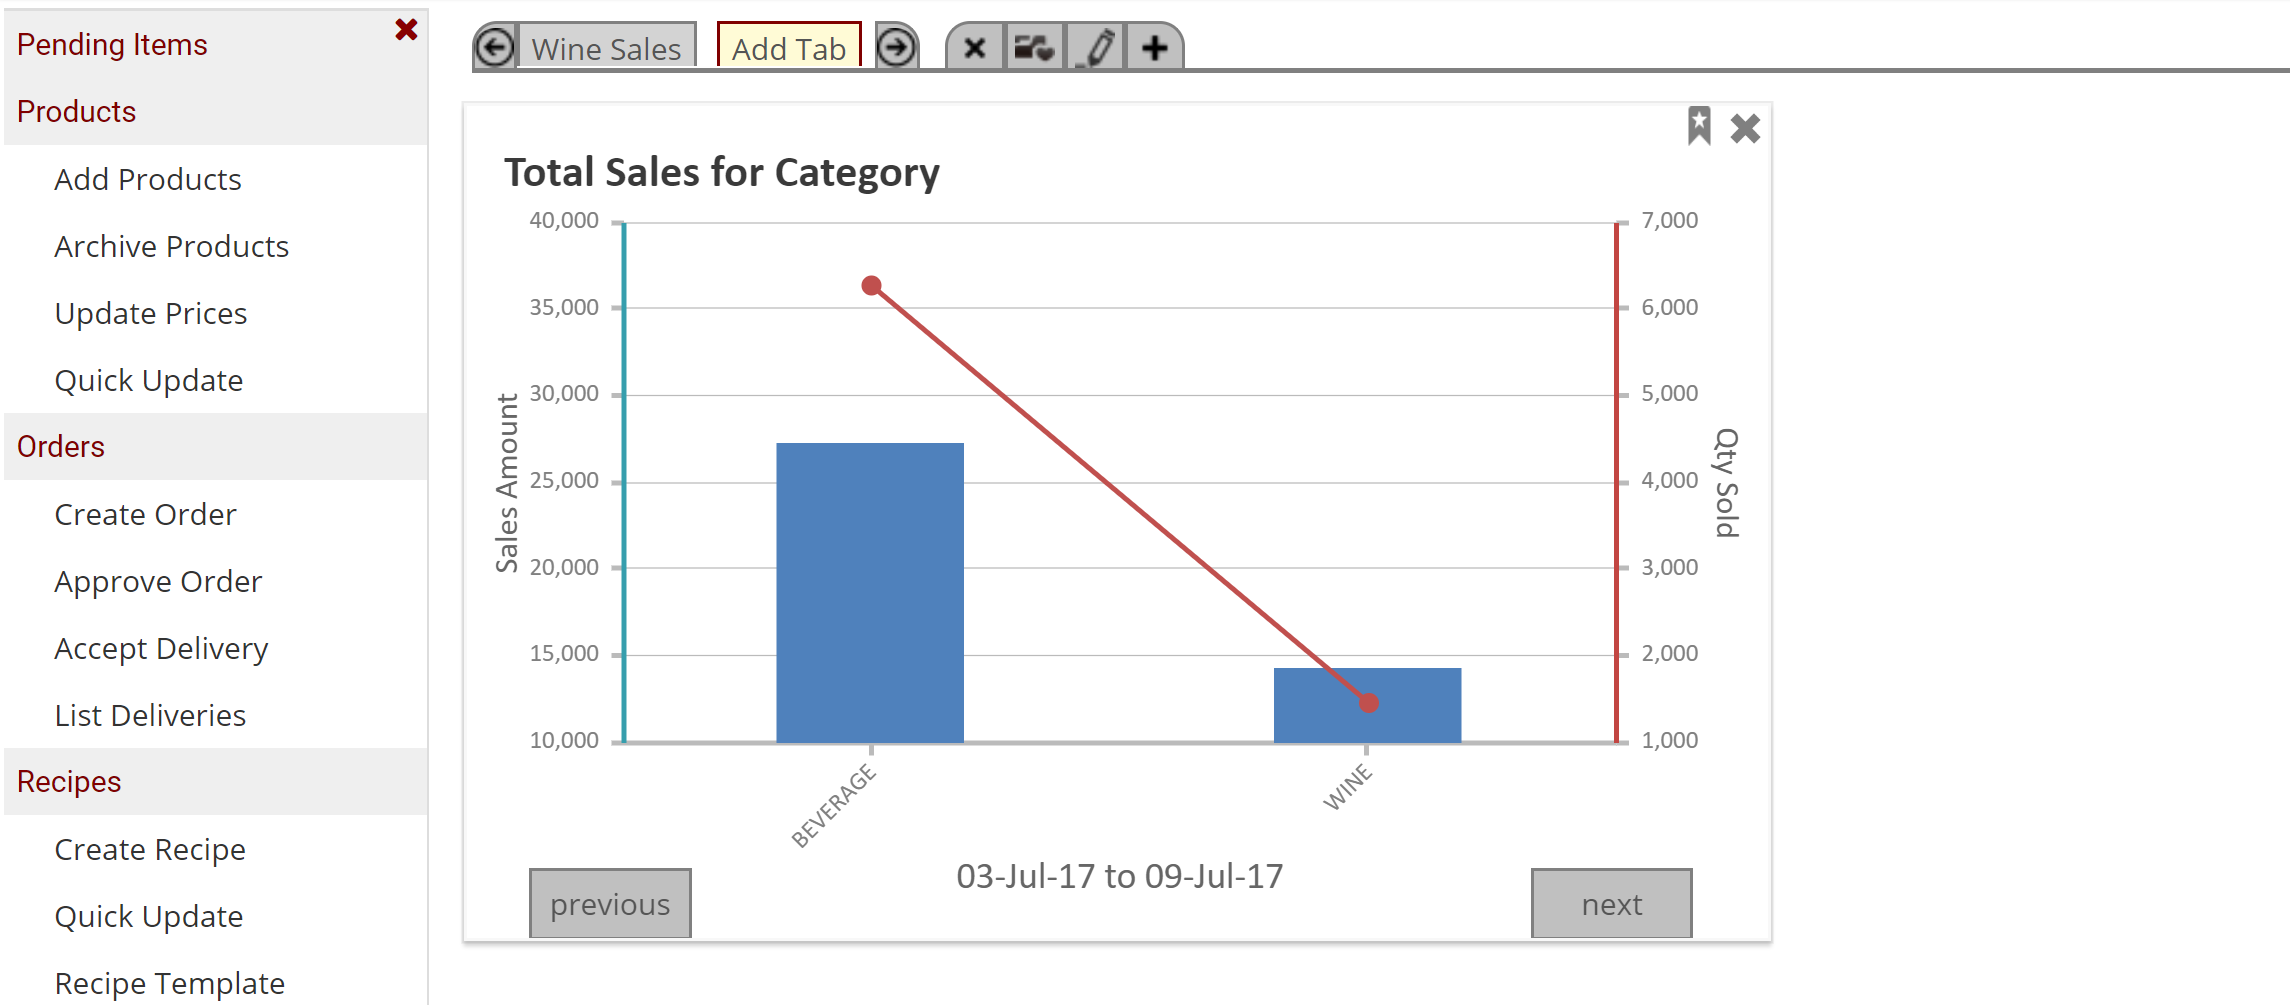
The above examples use the gadget titled Top 10 Sales items by Sales Value. This gadget displays:
First Level:
- Sales Amount (left axis, blue bars) vs Quantity Sold (right axis, red line) by category across a single period. You can change the period using the previous and next buttons below the graph.
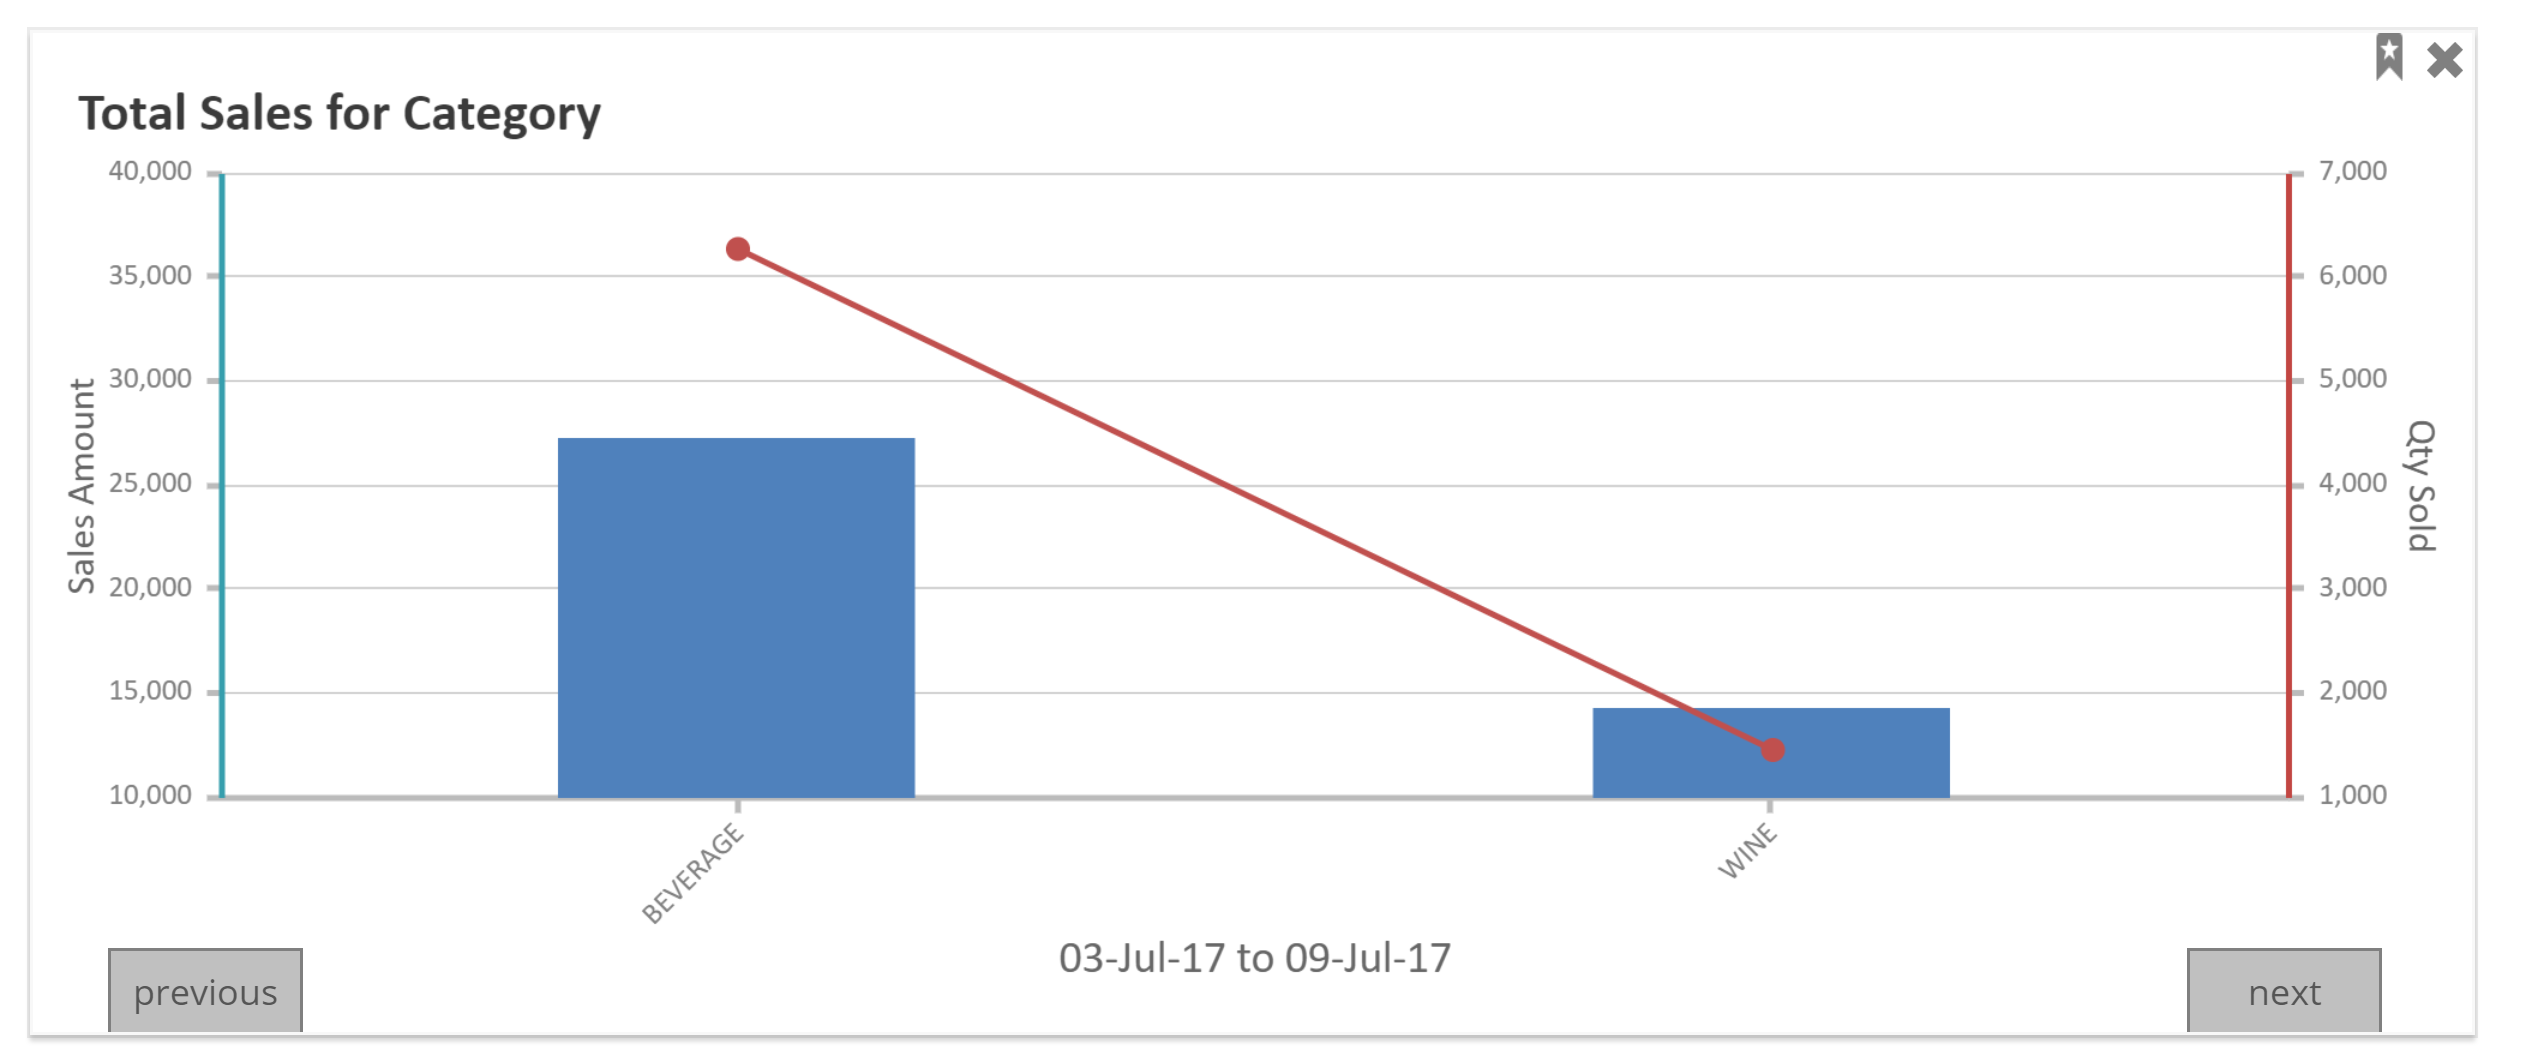
- Click on one of the blue bars to reach the next level of drill down information.
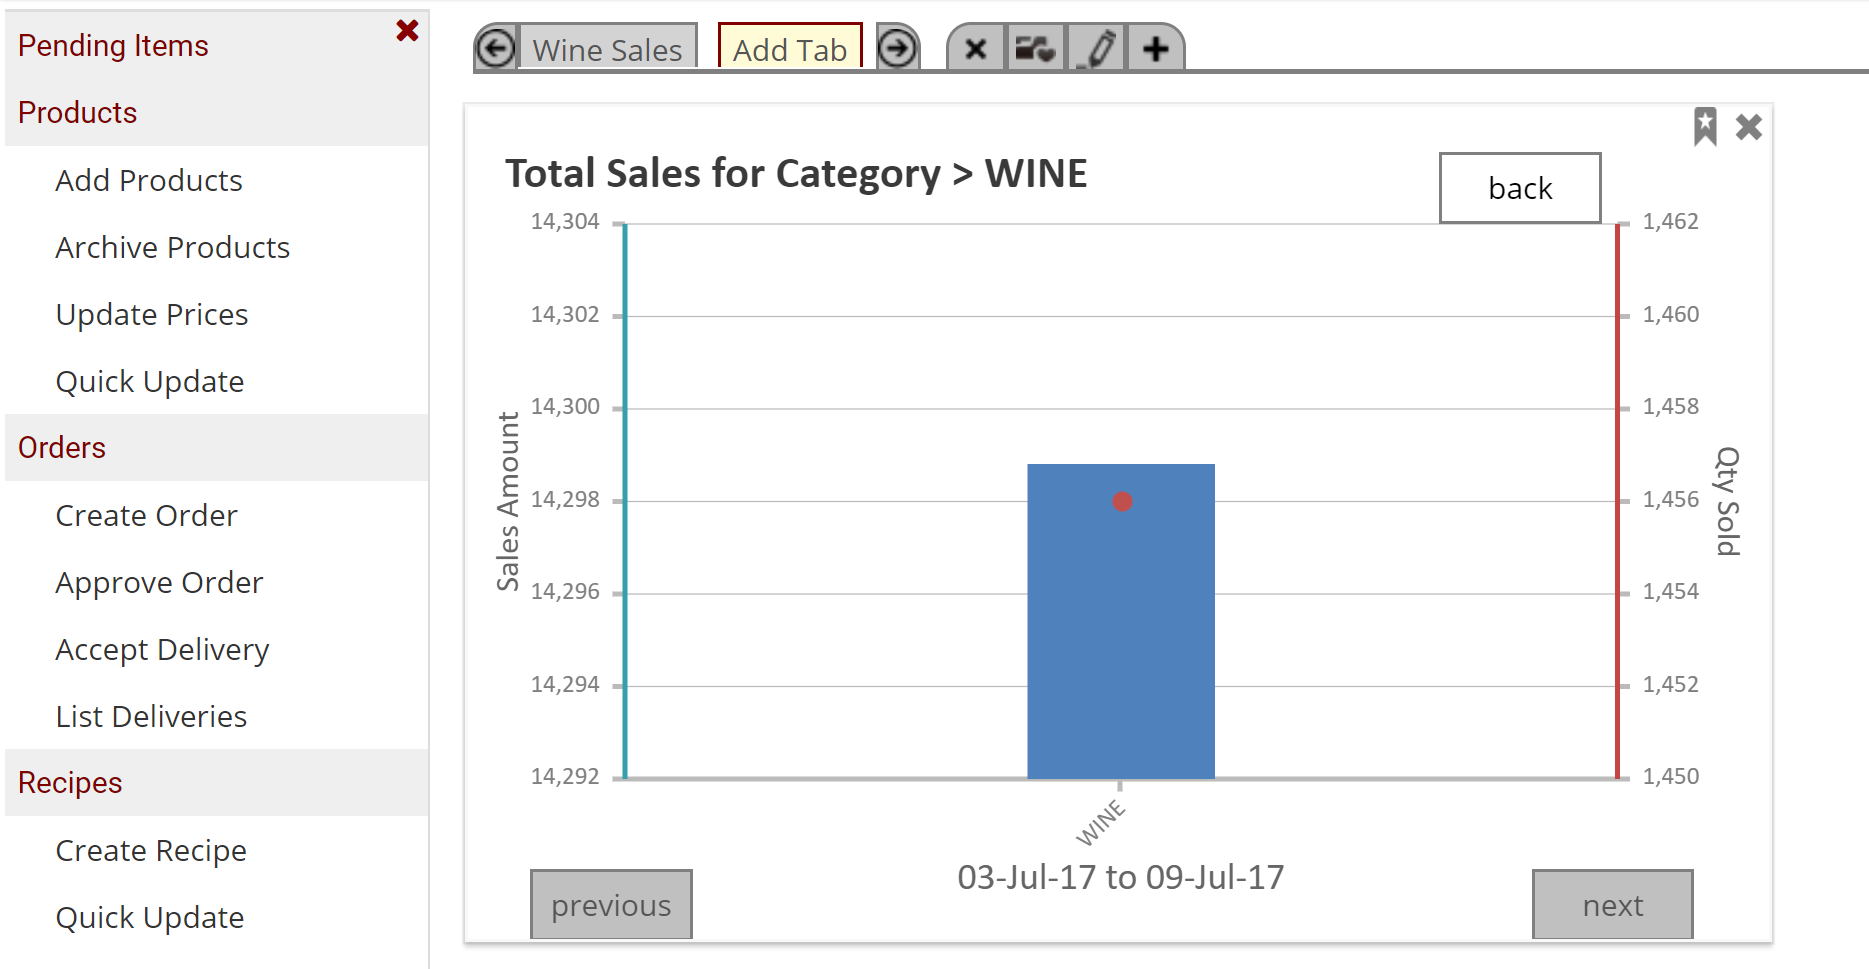
Second Level:
- Sales Amount (left axis, blue bar) vs Quantity Sold (right axis, red line) on your selected sales category across a single period. You can change the period using the previous and next buttons below the graph.
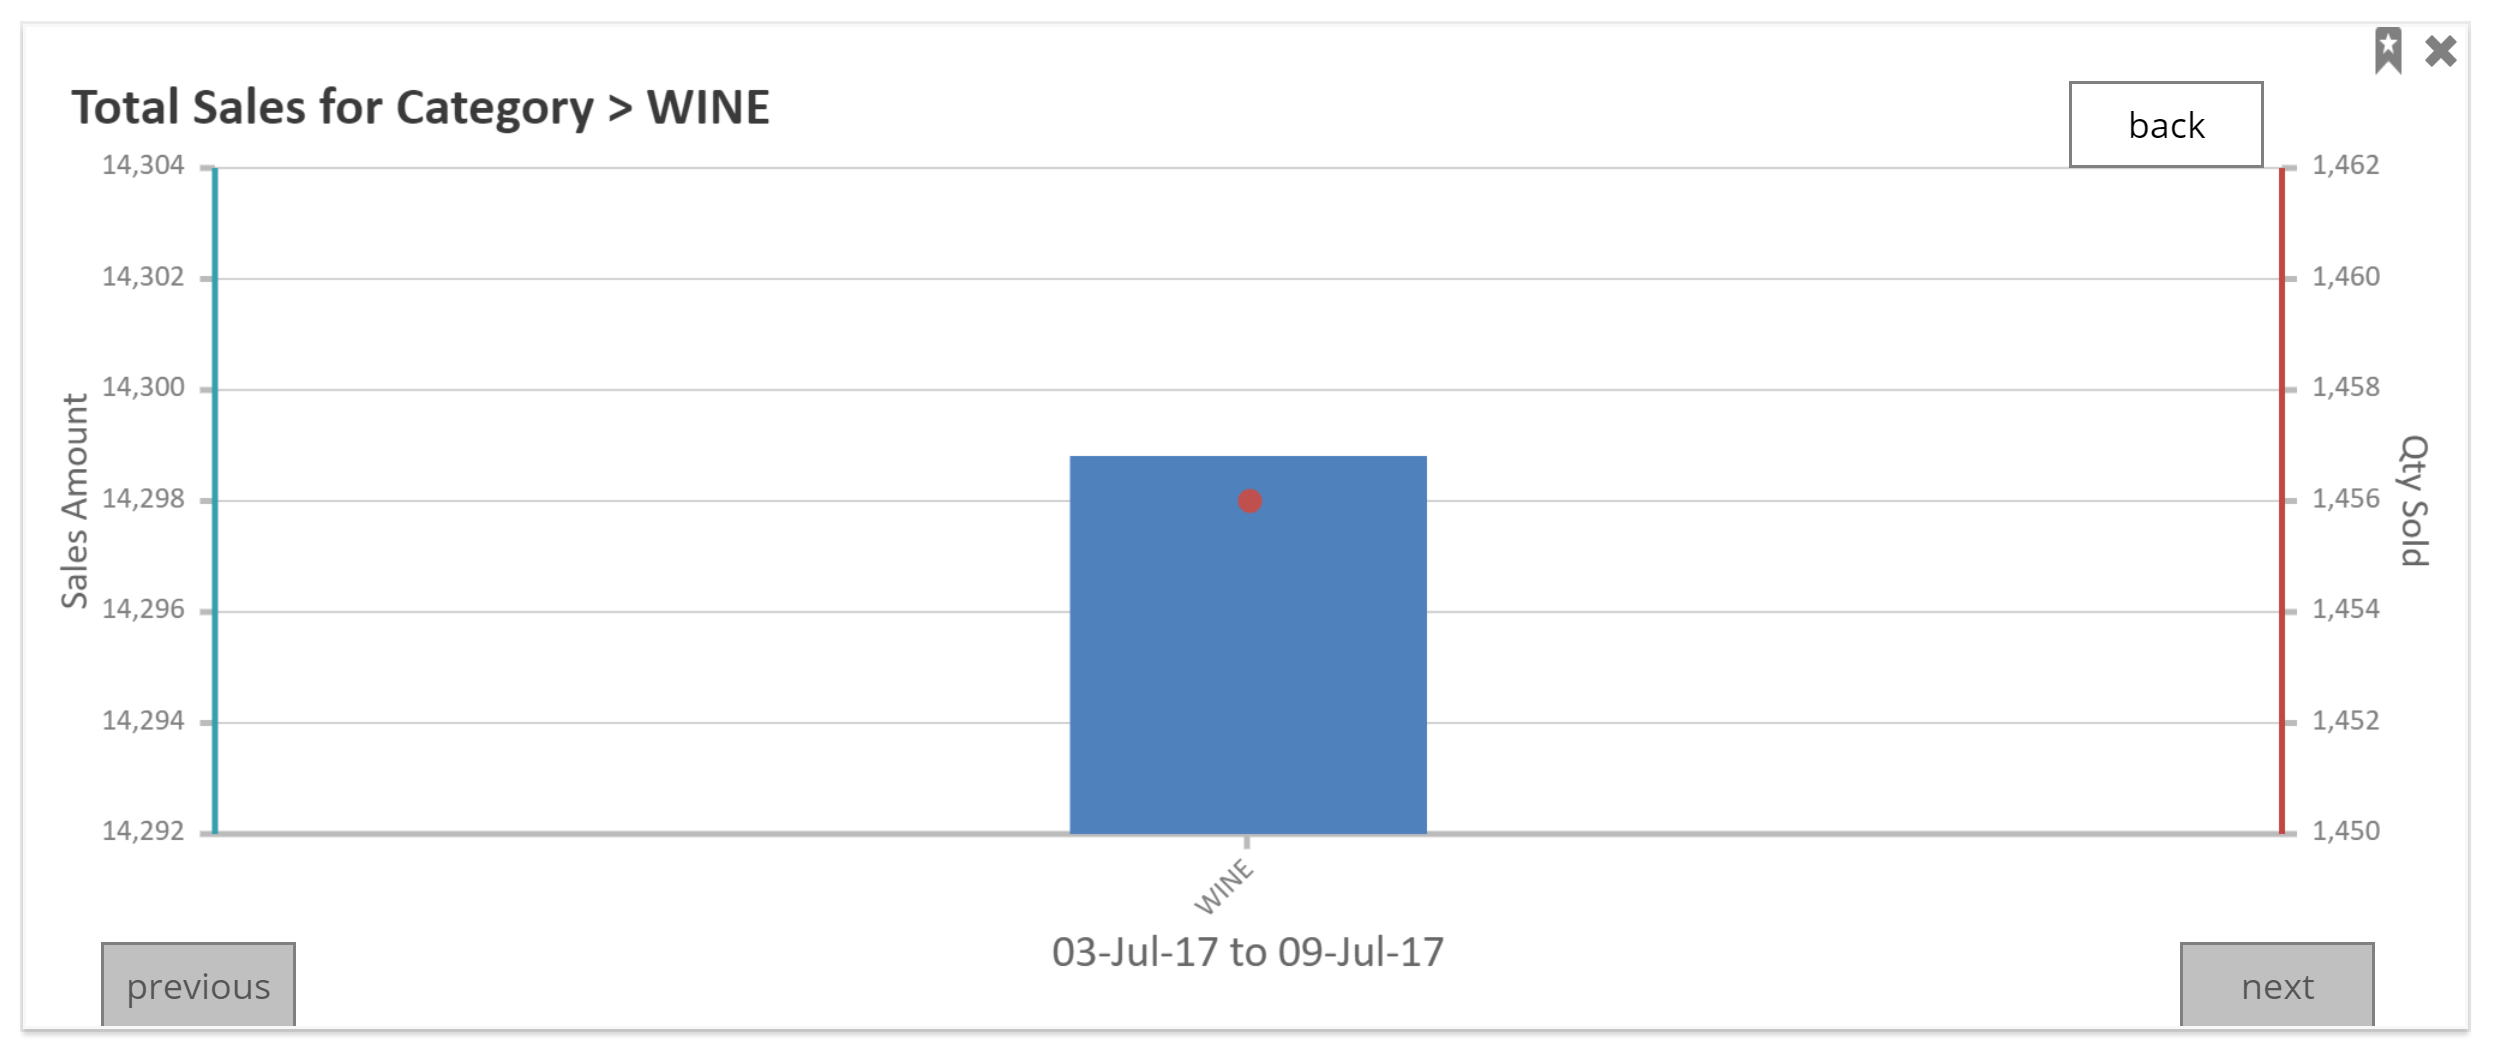
- Click the blue bar to reach the next level of drill down information.
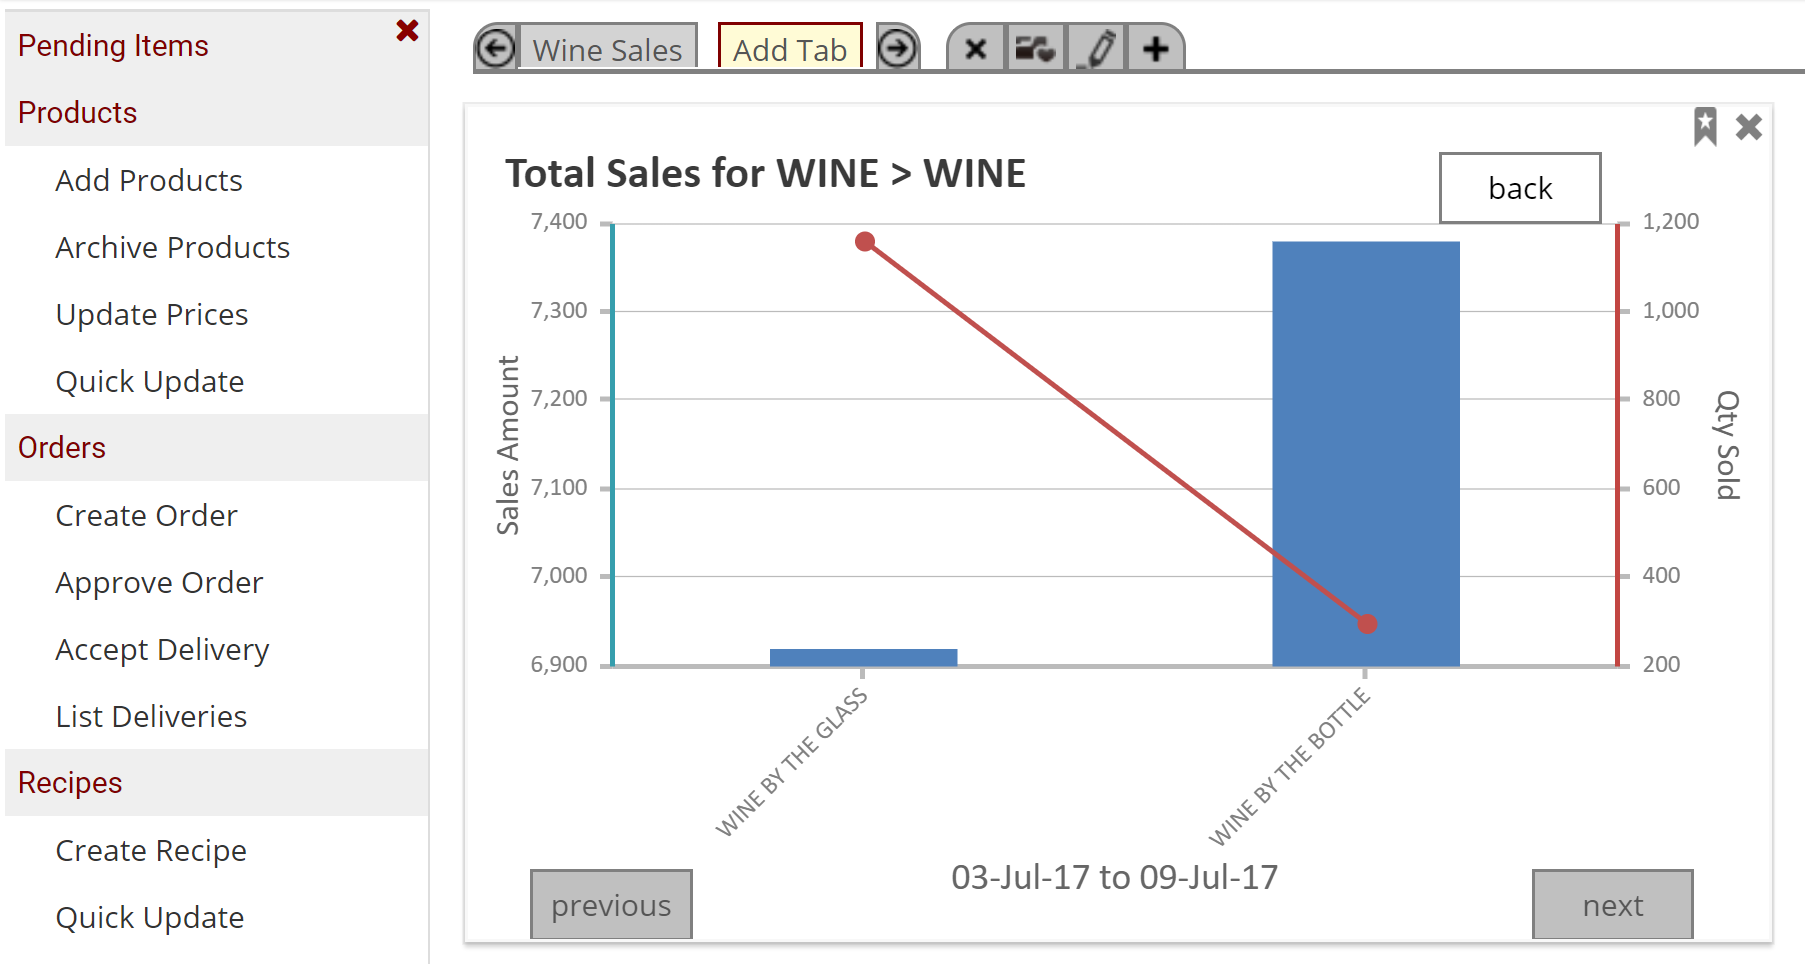
Third Level:
- Sales Amount (left axis, blue bars) vs Quantity Sold (right axis, red line) by sales groups across a single period. You can change the period using the previous and next buttons below the graph.
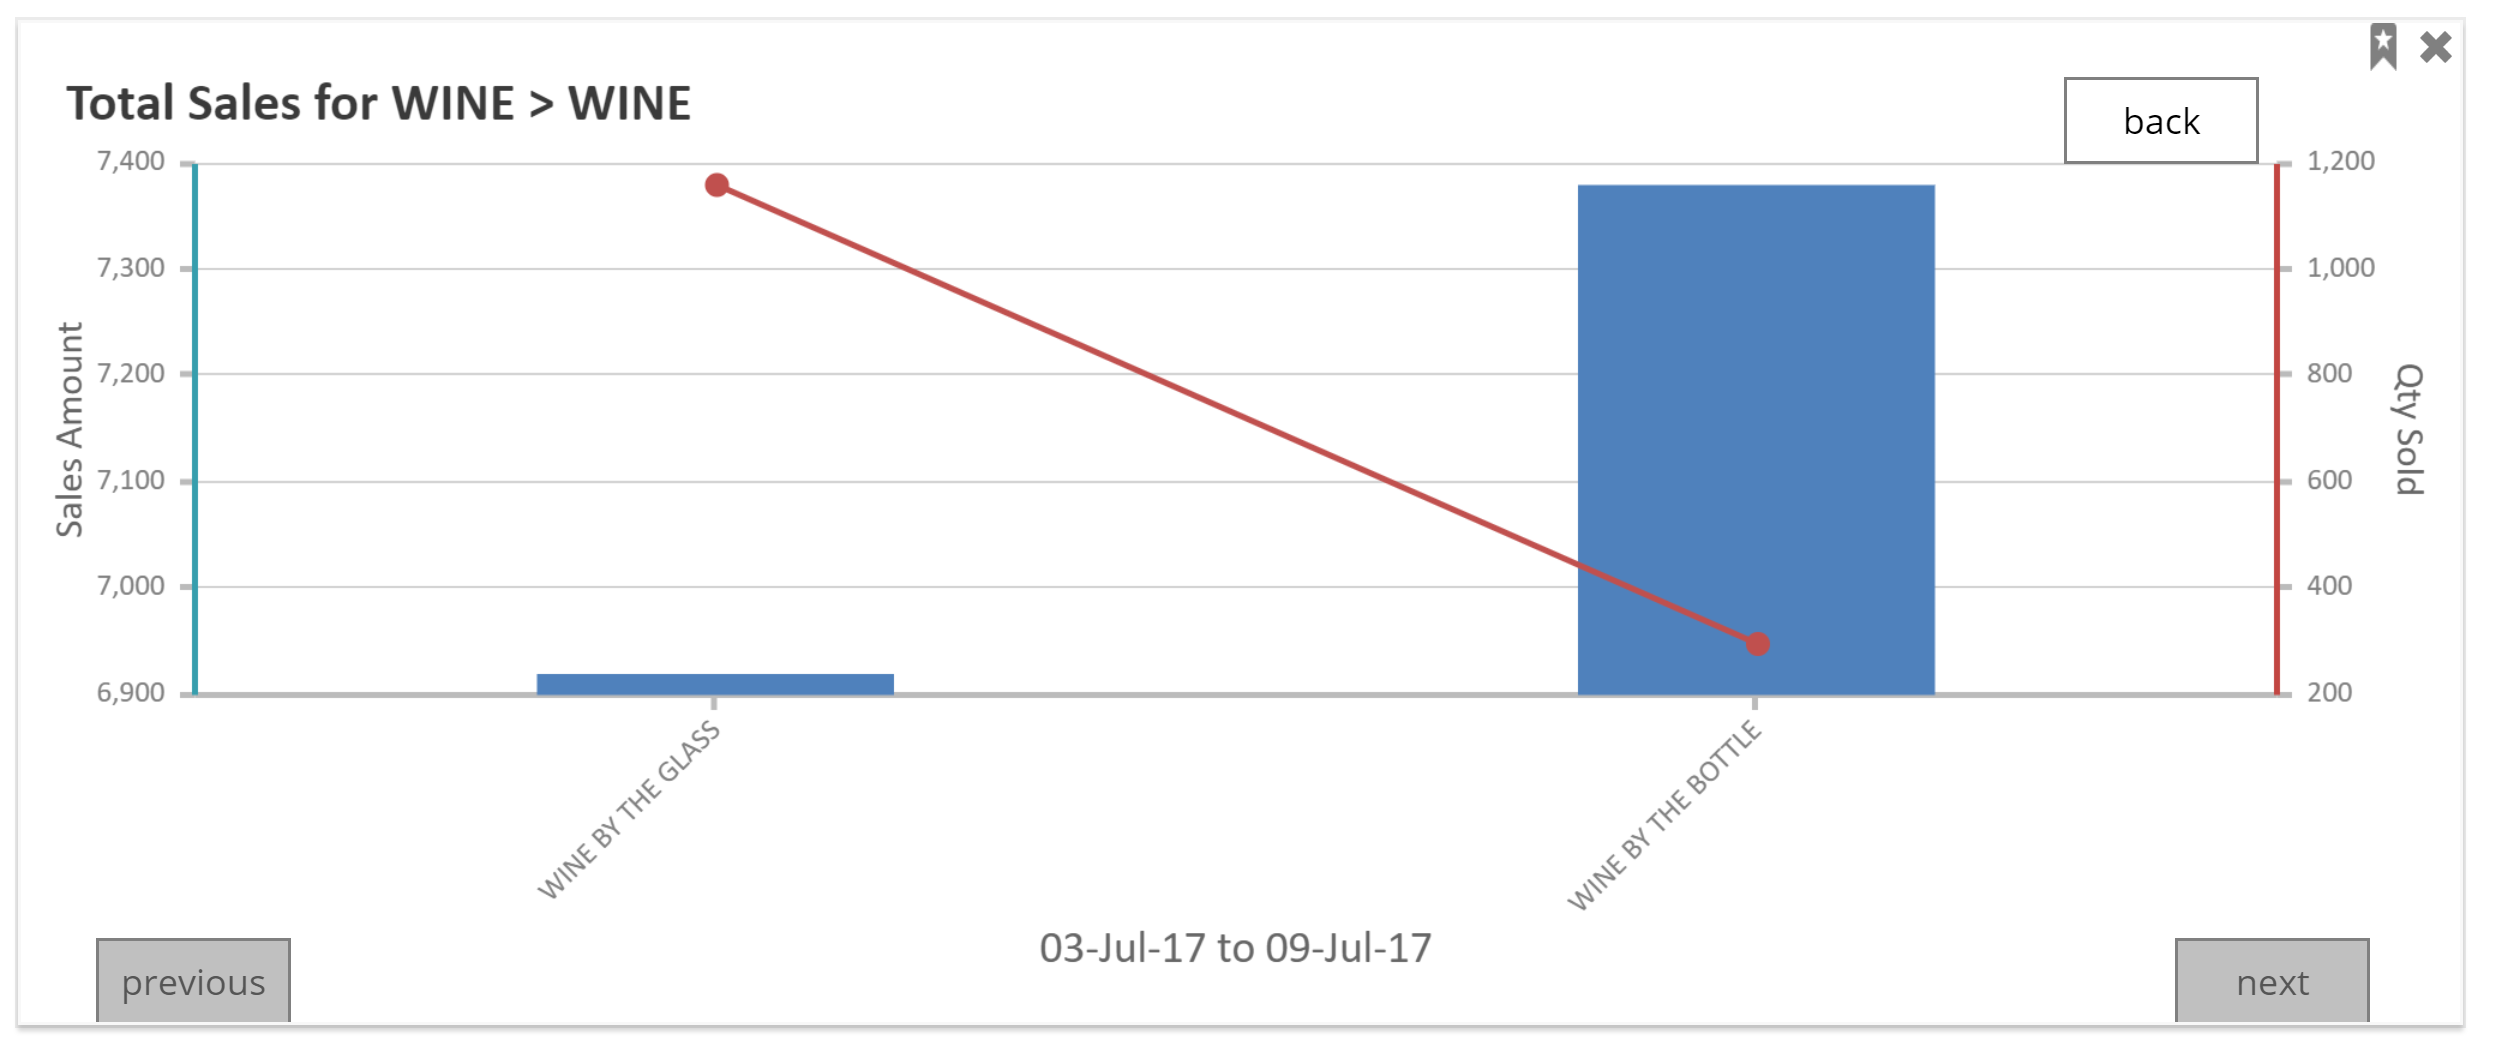
- Click on a blue bar to reach the next level of drill down information.
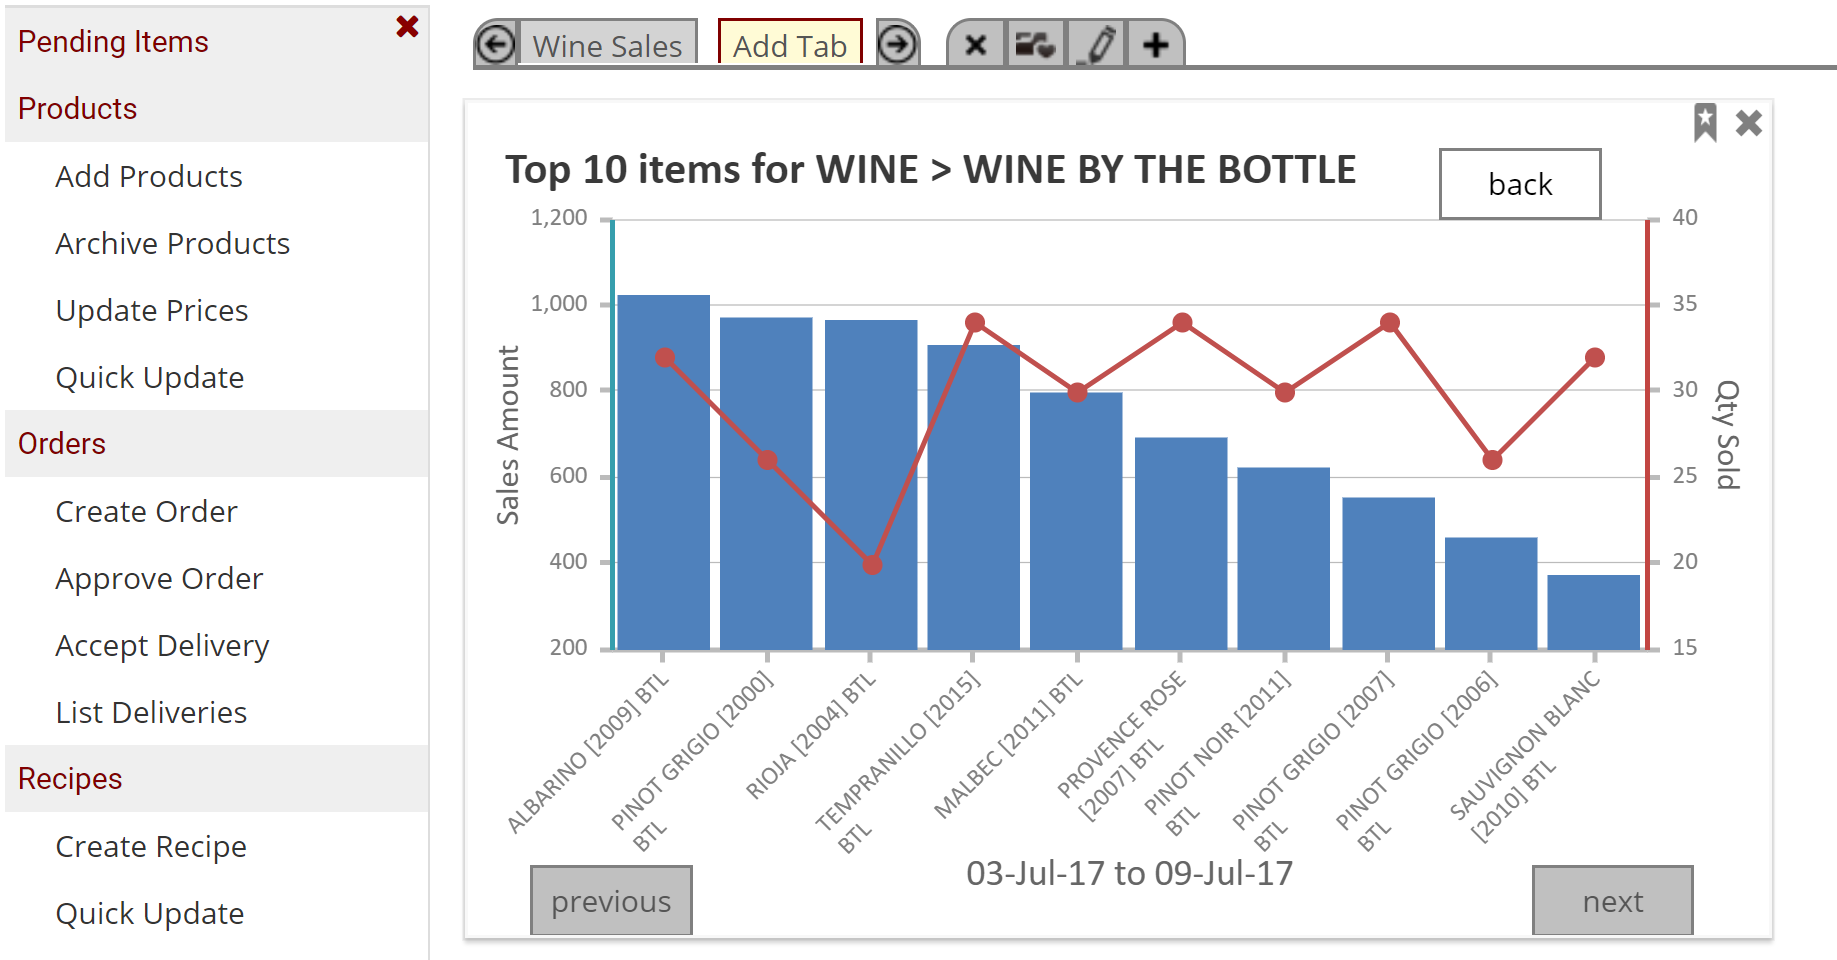
Fourth Level:
- Top 10 Recipe Items by Sales Amount (left axis, blue bars) vs Quantity Sold (right axis, red line) across a single period. You can change the period using the previous and next buttons below the graph.
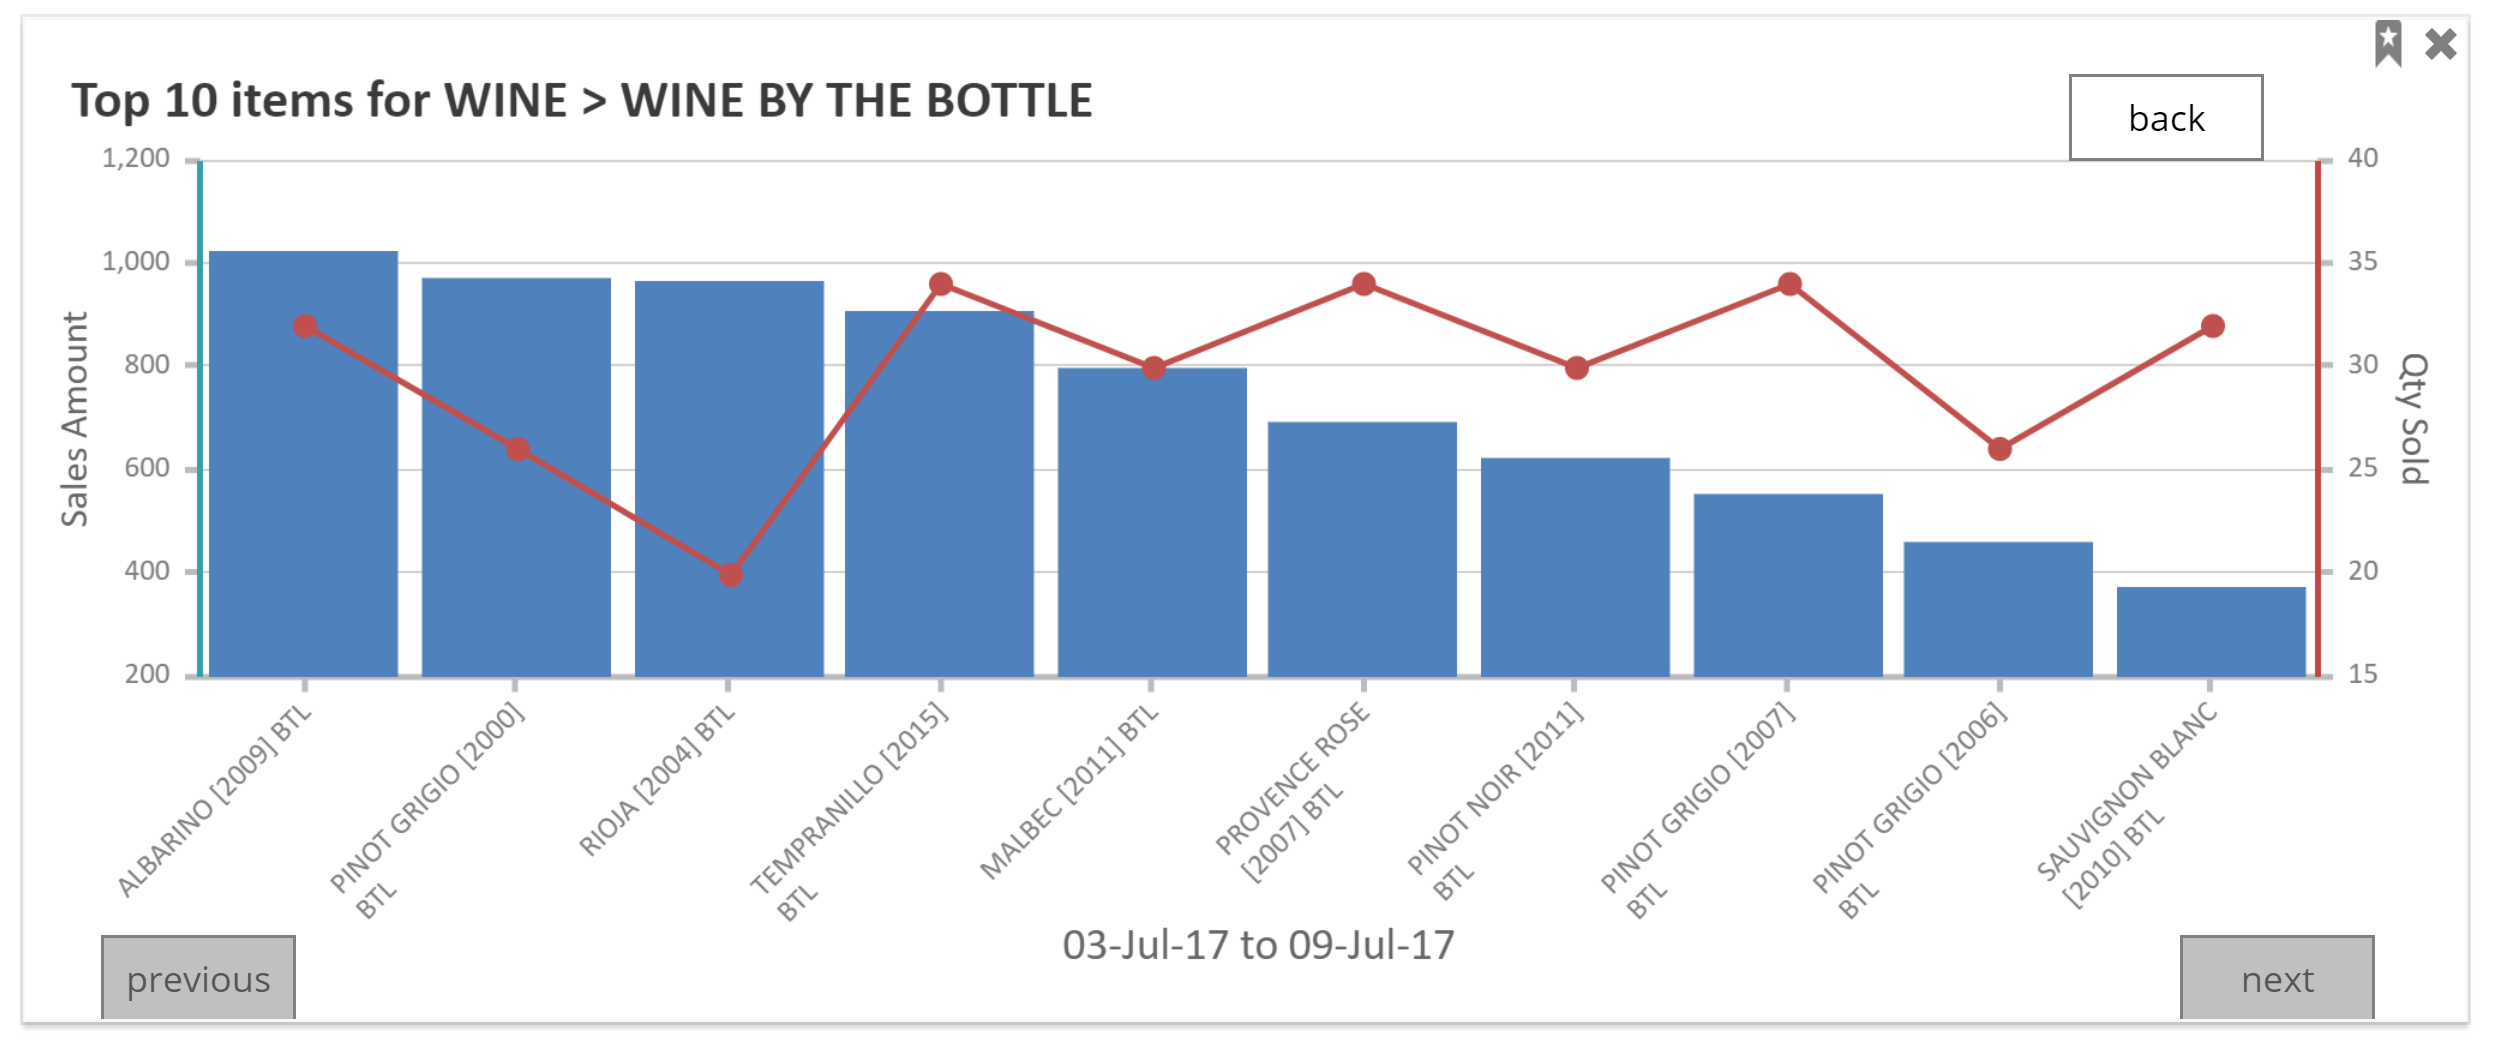
- Once you have reached the final level of a dashboard gadget, clicking on the blue bars will no longer drill down any further.
- To move back a level from your drill downs simply click the
 button.
 - At any level of your gadget you can use the
 tag to make that particular level your default view. The next time you navigate to your dashboard, this particular level will be the first one you see. This is especially helpful to customise your dashboard.
 - You can add multiple gadgets to a tab. Readability will depend on your chosen gadgets, and the size of the screen / browser / zoom level.
- The additional dashboard controls
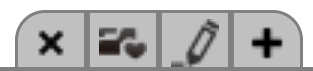 are, from left to right:
- Delete Tab
- Make Current Tab Default
- Edit Tab Name
- Add Gadget
- You can delete a gadget from a tab at any time using
 .
. - Hovering over the elements of the dashboard will reveal further information.
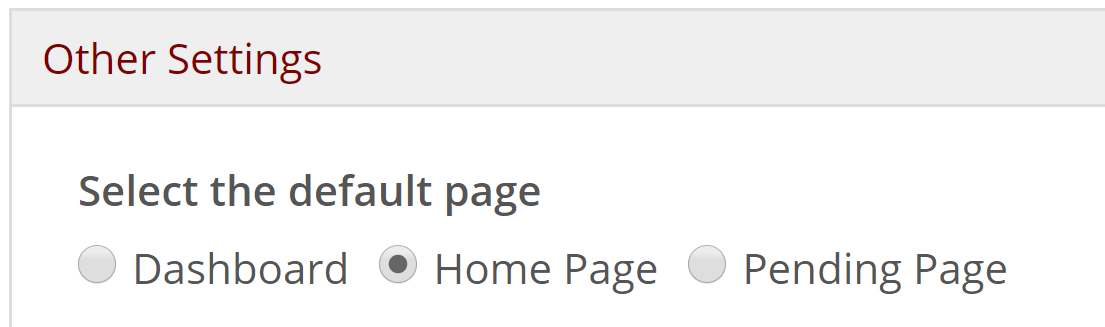
- Different gadgets provide different information and drill down levels. Experiment to find what works for you, as the dashboard can be a very useful snapshot tool. To aid this, there is an option in the user settings menu (found by clicking on your username on the top right of the screen) to make your dashboard your default home page.
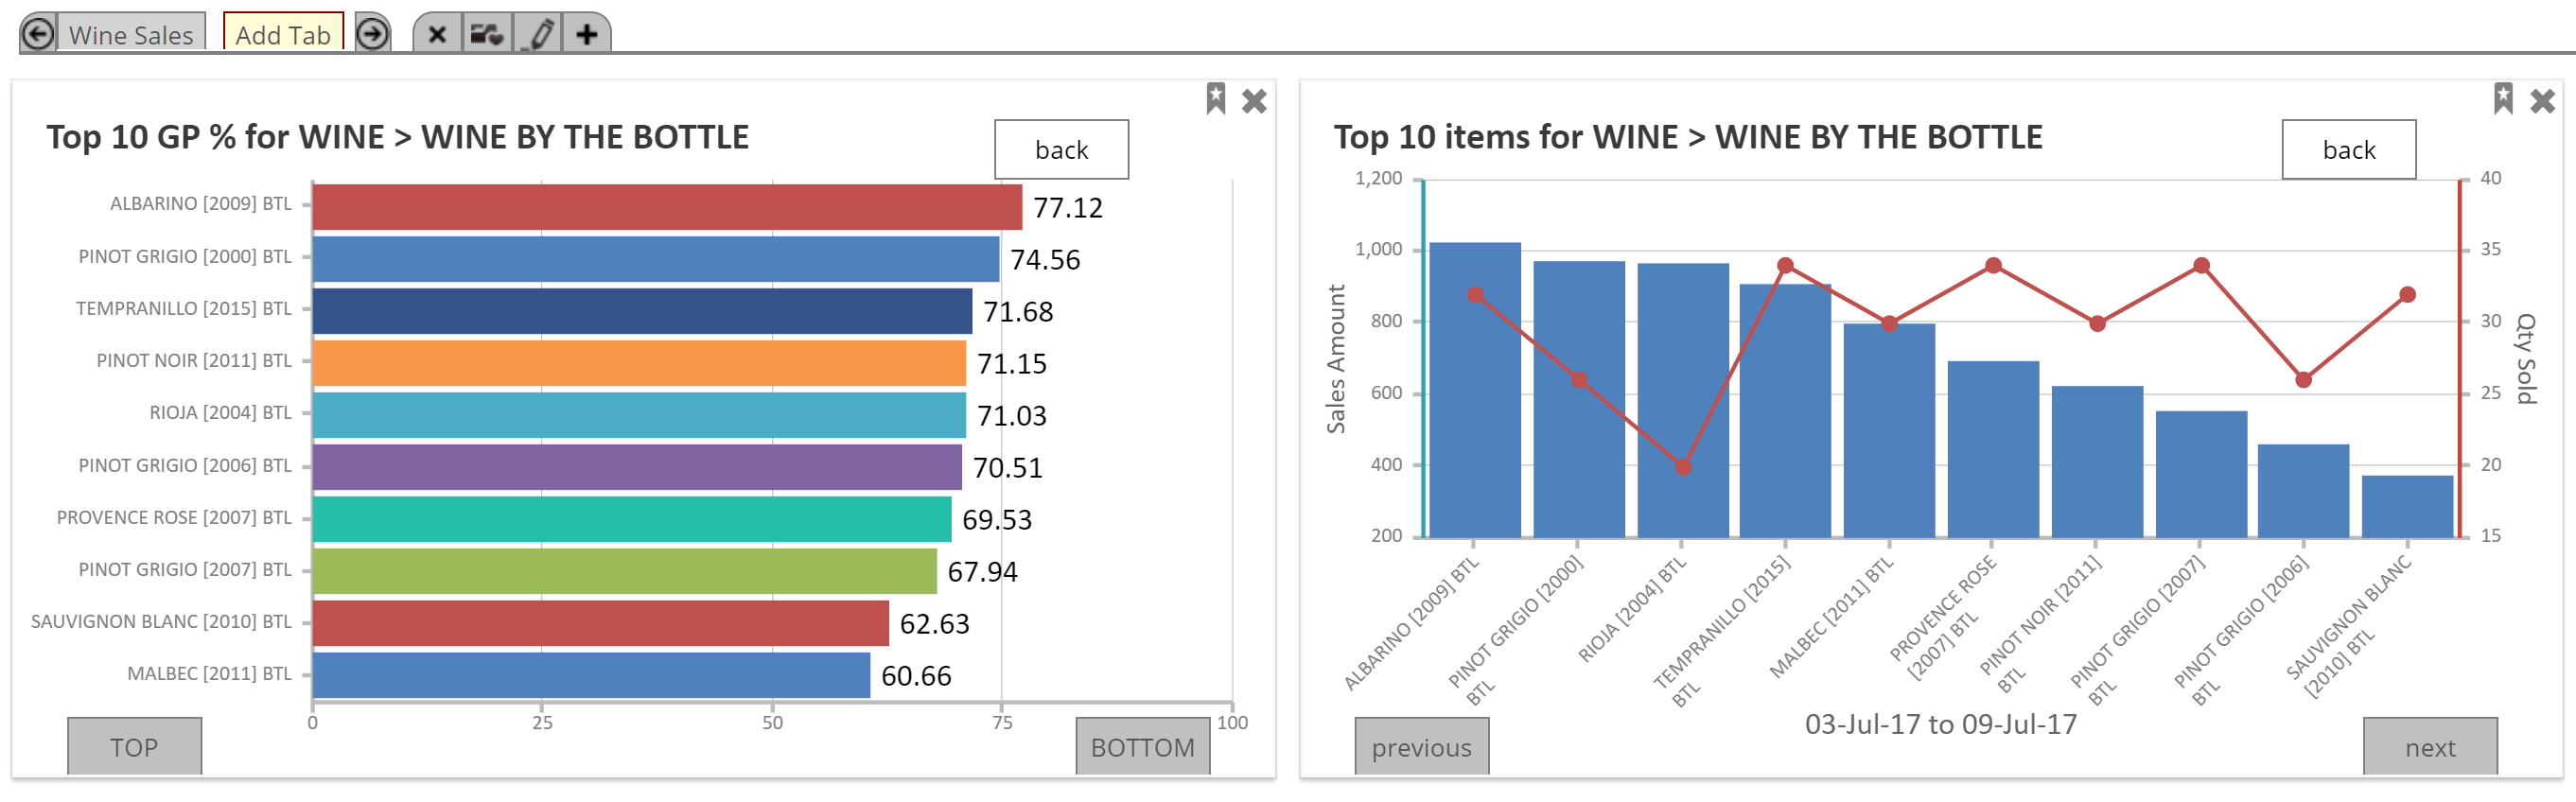
- As an example, a Sommelier may wish to see top 10 wine sales and top 10 wine GPs on one page as soon as they log in:
If you have any questions or feedback regarding the dashboard feature please contact the STO Support Team.
Comments
0 comments
Article is closed for comments.